Description
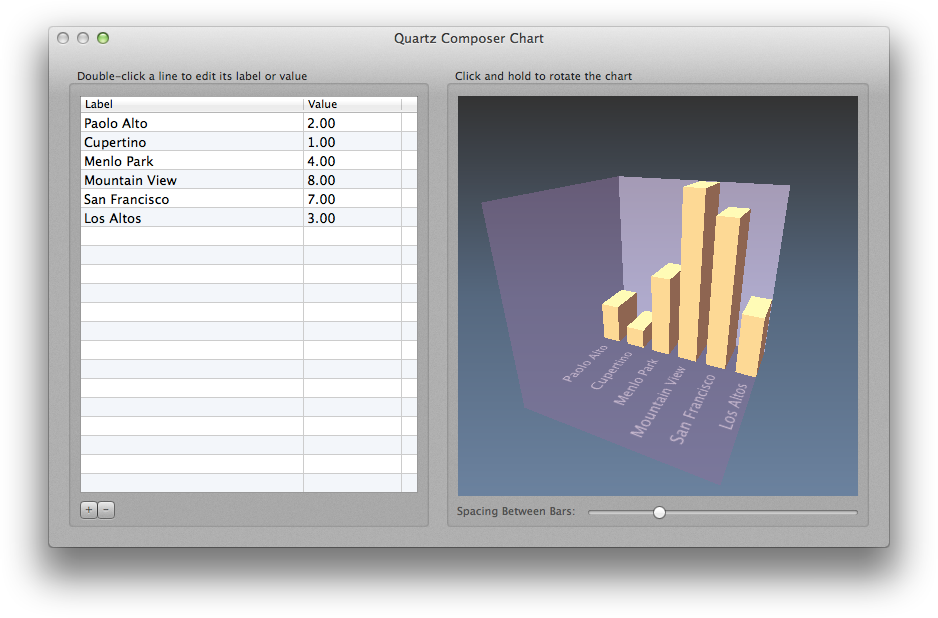
The sample uses a Quartz Composer composition that draws 3D chart according to the data given by the user. The data are stored in an array. Each entry in the array is a dictionary that contains label and value. The QC composition uses the iterator patch to draw the bar for each entry in the array. When the user modifies the data, the Quartz Composer composition re-render and update the chart.
Requirements
This sample requires OS X 10.5 or higher.
Screenshot